Get Full Visibility into Kubernetes with Icinga
Icinga's status indicators and context-driven alerts will give you clear visibility over your Kubernetes clusters and on-premises environments.
5/22/20254 min read


Kubernetes makes deploying and scaling applications easier—but keeping an eye on everything happening inside your clusters? That’s a different story. With pods spinning up and down, services shifting, and configurations changing constantly, traditional monitoring tools often fall behind.
That’s where Icinga comes in. Whether you're managing a handful of clusters or running a hybrid mix of cloud and on-prem infrastructure, Icinga gives you the clarity and control you need—without the complexity.
Why Kubernetes Monitoring Needs a Smarter Approach
Kubernetes environments are fast-moving and complex. Resources come and go quickly, and it’s not always obvious when something’s wrong—or why. You need more than just metrics. You need context.
Icinga’s approach to Kubernetes monitoring is built for this challenge. It goes beyond simple uptime checks to deliver real-time status indicators, intelligent alerts, and a clear picture of your cluster health. No guesswork, no digging through dashboards.
What’s Inside Icinga for Kubernetes?
Icinga for Kubernetes is made up of two key components:
The Daemon
This connects directly to your Kubernetes API to track changes in your resources—nodes, pods, services, and more. It writes everything to a dedicated database so you always have the latest picture.The Web Interface
A clean, powerful UI that makes your cluster data easy to understand. Quickly see what’s running, what’s not, and where your attention is needed.
You can run both components inside or outside your Kubernetes cluster, depending on what works best for your setup. Right now, each deployment monitors one cluster—but we’re always expanding capabilities.
What Makes It Different?
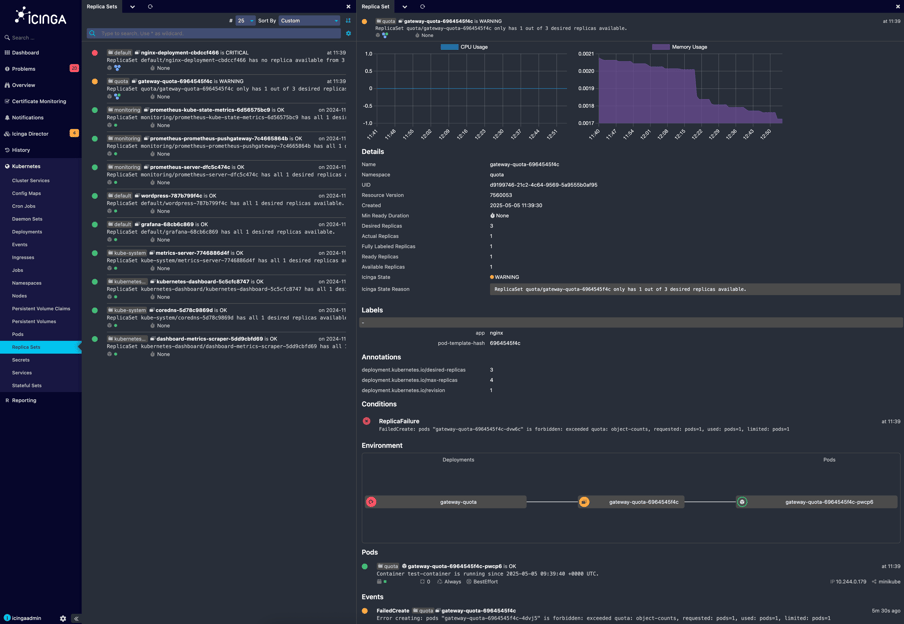
Here’s an example: A sysadmin receives a notification from Icinga—a specific ReplicaSet is marked as critical because it’s stuck in a restart loop. The alert identifies the root cause: a faulty configuration file. With this context, the admin quickly updates the file and resolves the issue—no need to dig through logs or run multiple CLI commands.
🚀 Instant Cluster Awareness
Skip the manual setup. Icinga automatically discovers your Kubernetes resources and begins monitoring them with minimal configuration. You get actionable insights out of the box.
🔔 Alerts That Make Sense
Don’t settle for vague warnings. Icinga sends context-rich notifications that help your team pinpoint and resolve issues fast. Whether it’s a crashing pod or a failed service rollout, you’ll know what happened—and why.
🔐 Fine-Grained Access Control
Need different access for devs, ops, or stakeholders? Icinga includes role-based permissions, so every user sees what they need (and only what they need).
🌐 Monitor Everything, Everywhere
From cloud-native Kubernetes clusters to legacy on-prem infrastructure, Icinga brings everything into a single, unified view. No more jumping between tools or missing pieces of the puzzle.
📊 Integrations You Already Use
Use Prometheus for metrics? Grafana for dashboards? Icinga connects with both, giving you deeper observability without rebuilding your stack.
Simple to Deploy, Easy to Maintain
With official Helm charts and clear documentation, getting started with Icinga for Kubernetes is quick and painless. Whether you're running a single cluster or a more complex setup, our flexible deployment options let you tailor the experience to your needs.
Designed for Real Teams, Not Just DevOps Experts
At the end of the day, monitoring is about helping people. Icinga doesn’t just collect data—it translates it into clarity. From status indicators to helpful alerts, it keeps your team one step ahead of issues and focused on delivering value.
Whether you’re running Kubernetes in production or just getting started, our managed monitoring and observability service powered by Icinga will help you stay in control.
Frequently asked questions about kubernetes monitoring
🆚 How is Icinga different from Prometheus?
Prometheus is fantastic at collecting detailed metrics—it’s a data powerhouse. But when it comes to understanding what’s really going on, it can get overwhelming.
That’s where Icinga comes in.
Icinga doesn’t replace Prometheus—it enhances it. It takes all those raw metrics and adds context, clarity, and structure. Instead of staring at charts and trying to figure out what’s wrong, you get clear status indicators—green for healthy, yellow for warning, red for critical—along with alerts that actually tell you what’s broken and why.
🌐 Can I monitor both Kubernetes and on-prem systems with Icinga?
Yes, and that’s one of the things people love most about Icinga.
You don’t have to choose between modern and legacy environments. Icinga brings everything—your Kubernetes clusters and your on-prem infrastructure—into a single dashboard. That means less jumping between tools and more confidence that nothing’s slipping through the cracks.
🔄 Does Icinga replace Prometheus?
Nope—it works with Prometheus. Prometheus collects your metrics, and Icinga helps you make sense of them.
Think of it like this: Prometheus tells you how many requests per second your app is getting. Icinga tells you whether your app is healthy, whether services are failing, and if your users are about to notice a problem.
It’s a great partnership.
🚦 What do Icinga’s status indicators actually tell me?
They're like traffic lights for your infrastructure.
Instead of making you dig through metrics to figure out if something’s wrong, Icinga uses simple color-coded indicators to show the health of your Kubernetes resources. One glance and you know what’s good, what needs attention, and what’s on fire 🔥 (hopefully nothing!).
📊 Can I use Icinga to monitor more than one Kubernetes cluster?
Yes, you can.
Whether you’re running a couple of clusters in the cloud, across different environments, or managing a mix of dev, staging, and production setups, Icinga can bring all of that into a single, centralized view. You stay in control, no matter how complex things get.
Ready to Simplify Your Monitoring?
If you're looking for a hassle-free way to keep an eye on your Kubernetes clusters and infrastructure, we can help. Please Contact us to learn more or subscribe to our Managed Monitoring & Observability service with Icinga.
Monitoring
Expert System monitoring and observability
Contacts
WhatsApp: https://wa.me/917994024099
contact@sentineli.com
Ground Floor, Athulya IT Building, Infopark Campus, Kakkanad, Kochi, 682042, India
© 2025. All rights reserved.


